Dr. Claire Jantz

Land use and land cover change in the Upper Delaware River Basin

Dingman's Falls
Dingman's Falls in the Delaware Water Gap NRA.

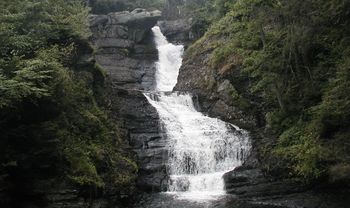
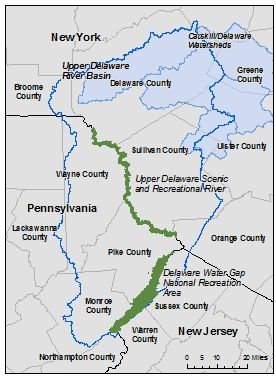
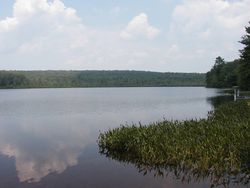
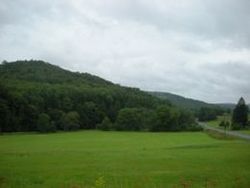
Forecasting Land Use Change in the Upper Delaware River Basin

The Upper Delaware River Basin lies at the intersection of New York, New Jersey and Pennsylvania. It has two National Park Service Units (Upper Delaware Scenic and Recreational River and the Delaware Water Gap NRA), which along with many state and privately owned recreational lands, has made this area an attractive destination for residents of the New York City metropolitan region. Four main counties in the Basin: Delaware and Sullivan in New York and Pike and Wayne in PA. The northern part of the Basin also encompasses the watersheds referred to as the Catskill/Delaware watersheds, which provide clean drinking water to half the population of New York State: eight million in New York City, one million in upstate counties, plus all the commuters and tourists in the region. The New York City’s Catskill/Delaware System is one of the largest unfiltered surface water supplies in the world.
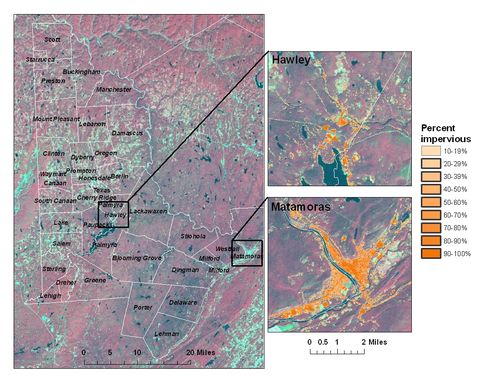
This scenic area is less than 100 miles from the New York-Northern New Jersey-Long Island metropolitan area. Some southern counties in the watershed are part of the metropolitan area, illustrating the strong economic and commuting ties that exist between this relatively rural region and a major urban center.  Particularly in the south where growth pressures are highest, recent residential and commercial development is threatening the integrity of many of these resources, primarily through forest fragmentation, impairment of water quality, loss of open space and wildlife habitat, and degradation of scenic views. Understanding how development has occurred in a region and predicting future patterns can be beneficial to both local governments and park managers as a tool for encouraging and striving towards sustainable growth. In 2003, this project began with a consortium, the River Valley GIS Group, consisting of GIS professionals and planners from local counties, the National Park Service, Shippensburg University, NASA and NASA contractors, and the Woods Hole Research Center.

Upper Delaware River Basin


The initial phase of the project has focused on the four primary counties in the basin: the Pennsylvania counties of Pike and Wayne, and the New York counties of Sullivan and Delaware.   As the project moves forward, the study area is being expanded to include a total of thirteen counties intersecting the Upper Delaware River Basin.  This project has and will produce many useful products, including maps and assessments of where development has occurred between 1984 and 2005, and where it is likely to occur in the future, given different policy and growth scenarios.

Land Cover Change Mapping

Establishing historic patterns of urbanization was the first phase of the project.  Collaborator, Dr. Eric Brown de Colstoun, of SAIC and NASA Goddard Space Flight Center, developed impervious surface maps from Landsat 5 Thematic Mapper (TM) satellite images for 1984, 1995, and 2005.Impervious surface area

An example of the impervious surface data for 2005 is shown above. The image on the left shows the raw Landsat imagery (red indicates vegetation, cyan indicates impervious surfaces or bare soil, and black indicates water). The image on the right shows, in orange, the location and intensity of impervious surfaces that are derived from the Landsat image.

Change between 1984-2006

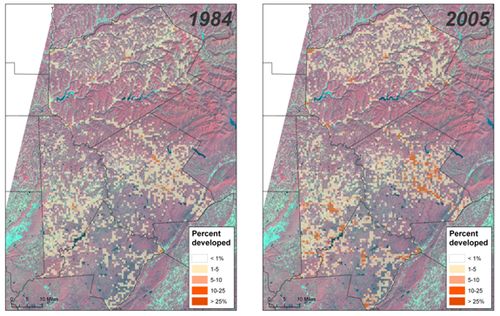
The extent and intensity of development in 1984 (left) and 2005 (right) for the four counties shown above.The orange indicates the location and intensity of development for 1 km x 1km pixels. The original data are at a finer resolution (30 m x 30 m pixels), but have been scaled up to a coarser resolution to show regional patterns.

Land Use Change Modeling Approach

The group settled on a model called SLEUTH as a tool for predicting growth patterns in the rural river valley. This freely available, public domain model was developed by Dr. Keith Clarke, a geographer at the University of California, Santa Barbara, with funding from the United States Geological Survey (USGS) Urban Dynamics Program. Since its public release in 1997, the SLEUTH urban growth model has been used to simulate urban development patterns in locations across the United States and the world.

Implementation of the model occurs in two general phases: calibration, where historic growth patterns are simulated; and forecasting, where the historic patterns of growth are projected into the future. Other inputs include transportation networks and a data layer that describes where development is more or less likely to occur (exclusion/attraction layer). The county planners have been integral in developing the exclusion and attraction layer by providing data and local expertise on what is driving local growth pressure. Based on all of these inputs, the model “learns” to replicate the historic patterns of development (calibration) and the results are used for forecasting future urbanization.

Lake in Pike County

Delaware County

Natural and scenic resources such as those pictured here (a lake in Pike County and open space/farmland in Delaware County) are potentially at risk due to development pressure.

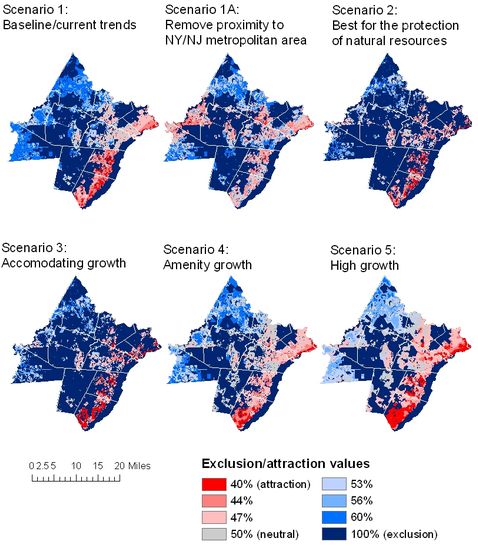
An individual exclusion/attraction layer was developed for each of the four counties included in the original study, and calibrations and forecast scenarios to 2030 were run separately for each county.  For example, Pike County, which borders both UPDE and DEWA and which has been one of the fastest growing counties in the state of Pennsylvania for over a decade, identified five alternative future scenarios.

  • Baseline/current trends (Scenario 1)
    • A “what if” scenario removing the influence of the growth pressure originating from the New York-Northern New Jersey-Long Island metropolitan area (Scenario 1A)
  • Best for protection of natural resources, where natural resource lands have high levels of protection (Scenario 2)
  • Protection of natural resources while accommodating growth, where natural resource lands are protected, and growth is directed into designated growth zones (Scenario 3)
  • Amenity growth, where growth occurs around natural amenity features, such as lakes and park boundaries (Scenario 4)
  • High growth, where there are few protections placed on natural lands (Scenario 5)

Scenario maps for Pike County

Scenario maps for Pike County are shown above. Each map represents different assumptions about growth pressure and land use policies in the future. Red indicates areas of high growth pressure and blue indicates areas of low growth pressure.

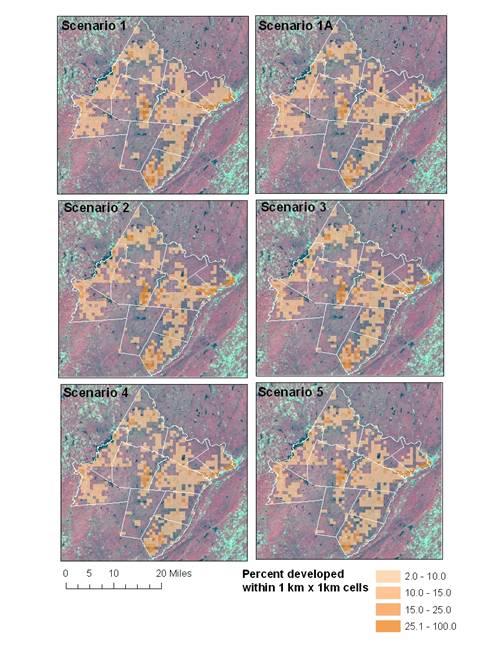
Forecasted growth 2030 in Pike County for each of the county-defined six scenarios.

Next Steps

As this project moves forward Shippensburg University and the National Park Service are working with a total of thirteen counties in New York, New Jersey, and Pennsylvania that intersect the Upper Delaware River Basin to establish a regional model. All of the counties are struggling to seek a balance between protecting land while still promoting economic development.  The collaboration between the counties, the NPS, and researchers has proven invaluable to the region as a whole.  As we move forward, facing new development challenges in the form of natural gas development, transmission corridors, and economic downturns, it is encouraging to work together to benefit the basin and the protection of the unique resources it provides.

Acknowledgements

We thank all of our project partners, especially the county planning staff in Pike, Wayne, Sullivan, and Delaware counties. This project was funded, in part, through grants from:

  • The Community Conservation Partnerships Program, Environmental Stewardship Fund, under the administration of the Pennsylvania Department of Conservation and Natural Resources, Bureau of Recreation and Conservation (BRC-TAG 11.5-31)
  • The NASA Land Cover Land Use Change Program (grant NNG06GC43G to S. Goetz, C. Jantz and others)
  • The National Park Service
  • Delaware County Planning Department

For More Information

Jantz, C.A. and L. Morlock. Modeling Urban Land Use Change in the Upper Delaware River Basin. May 2011. 29 p. PDF 5.1MB

Jantz, C.A., M. Mrozinski and E. Coar. Forecasting Land Use Change in Pike and Wayne Counties, Pennsylvania. April 2009. 45 p. PDF 2.98 MB

Jantz, C.A. Simulating Urban Growth with the SLEUTH Model: A Training Manual. June 2009. 20 p. PDF 644 KB. Training data (.zip file, 8.3MB).

Jantz, C.A. and S.J. Goetz (2007). Can Smart Growth Save the Chesapeake Bay? Journal of Green Building 2 (3): 41-51. PDF 3.78 MB

Jantz, C.A., S.J. Goetz, P. Claggett, and D. Donato (2010). Modeling regional patterns of urbanization in the Chesapeake Bay Watershed. Computers, Environment and Urban Systems 34:1-16. PDF 3.39 MB

Last updated January 2013
Page maintained by C. Jantz