Shift in Demographics
ï What contributed to growing aging population?
ï Segments of the older population
Shift in Demographics
People over the age of 65 make up approximately12.5% of the population in the United States. This figure is projected to go up to 20% of the population by 2050 (U.S. Bureau of the Census, 2000). Several countries already have larger percentages of older people than does the U.S. (See Table 1)
Table 1 Percentage of People Over
65
|
|
|
|
|
|
|
|
|
|
|
|
|
|
|
|
|
|
|
|
|
|
|
|
|
|
|
|
|
|
|
|
|
Table based on data from Population Reference Bureau (1999) http://www.prb.org/
It should be noted that the older population
is growing at different rates for countries throughout the world with many
countries showing fairly low percentages of older adults.
Table 2
|
|
|
|
|
|
|
|
|
|
|
|
|
|
|
|
|
|
|
|
|
|
|
|
|
|
|
|
|
|
|
|
|
|
|
|
|
|
|
|
|
|
|
|
|
Table based on data from Population Reference Bureau (1999) http://www.prb.org/
eQuestion #1:
Taking a look at tables 1 and 2 and the link to the Population Reference
Bureau
(world population data sheet 1999) what strikes you about these data? Include
other
countries not in these tables in your answer (Hint: go to http://www.prb.org).
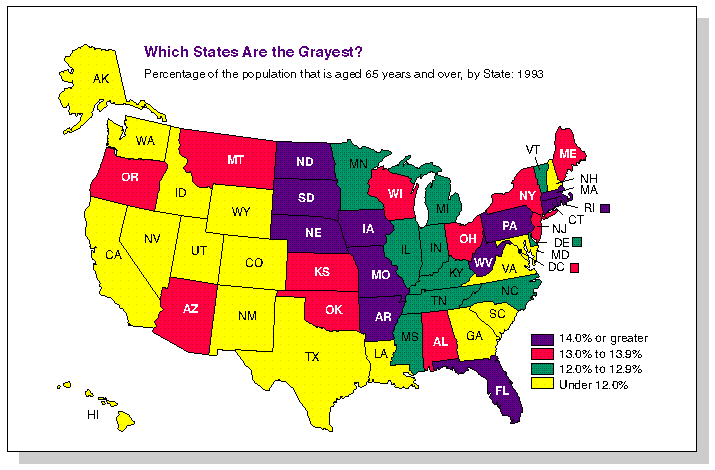
Below is the percentage of the population in the U.S. that is 65 years and older by state.
Table 3
Population 65 years and over by
state
|
|
|
|
|
|
|
|
|
|
|
|
|
|
|
|
|
|
|
|
|
|
|
|
|
|
|
|
|
|
|
|
|
|
|
14.0 |
|
|
|
|
|
|
|
|
|
|
|
|
|
|
|
|
|
|
|
|
|
|
|
|
|
|
|
|
|
|
|
|
|
|
|
|
|
|
|
|
|
|
|
|
13.0 |
|
|
|
|
|
|
|
|
|
|
|
|
|
|
|
|
|
|
|
|
|
|
|
|
|
|
|
|
|
|
|
|
12.0 |
|
|
|
|
|
|
|
|
|
|
|
|
|
|
|
|
|
|
|
|
|
|
|
|
|
|
|
|
|
|
|
|
|
|
|
|
|
|
|
(U.S. Bureau Census Bureau, 2000 http://www.census.gov/)
eQuestion #2:
Before going on to the next section, what are some things that you think
have
contributed to the growing population of older adults in the United States?
Also,
looking at the table below, what are your thoughts about the distribution
of the
percentages of older adults across the United States?

What Contributed to the Growing Aging Population?
1800
55
1840
52
1880
40
1900
32
100 yrs old
1920
30
80
1930
21
70
1940
19
60
1950
24
50
1960
24
40
1970
18
30
1980
16
20
1990
16.7
10
One item to note is that a high birth rate early on and to the mid-20th century contributed to the increase in number and percentage of the older segment of the population. As can be seen in the table many people who were born between 1900 and 1940 are now 60 and older.
A decline in the birth rate in recent decades.
Also seen in the table is a decline in birth rate over the years. A decline in birth rated is more important in increasing the percentage of older persons in a population than a decline in mortality rate. That is, an increase in number of births would lower the reported median age whereas, a decline in births would increase the reported median age.
Mortality Rate
A second factor has been discussed in the growth of an aging population--the decline in mortality.
Decline in Mortality
eQuestion #3: What are some factors that resulted in a decline in mortality rate?
The total mortality rate (number of deaths per 100,000) in 1960 was 1105 by 1988 that rate had dropped to 944. Several factors have lead to a decline in mortality (Crandall, 1991). They are:
ï Reduction in infant mortality
ï Reduction in maternal mortality
ï Increase in sanitation
ï Increase in personal hygiene
ï Reduction of infectious diseases
Increase in Life Expectancy
Athird factor is an increase in life
expectancy. People who study aging make a distinction between Life Expectancy
and Life Span.
|
|
|
| Average number of years a person is expected to live | Maximum number of years that human beings can live (Approximately 120 years) |
| Can be measured
from birth
Which is most common but Can be measured from any given year |
|
| Men 73 years
Women 80 years |
Dramatic changes in life expectancy have occurred during the 20th century. In 1900 the average life expectancy for both sexes was about 47 years of age. The average life expectancy in the year 2000 is 80 for women and 73 for men.
eQuestion #4:
What are some things that you can think of that may explain why men and
women
differ in life expectancy?
Segments of the Older Population
Over 85
One of the fastest growing segments of the older population are those who are 85 years of age and older. In 1990 this group made up 1.2% of the population (Crandall, 1991). From 1960 to 1990. This segment of the older population grew 232% compared to 39% increase in the total U.S. population and compared to an 89% increase in the population of 65 years of age and older. By 2050, this group is expected to make up 5% of the total U. S. population.
Siegel and Tauber (1986) discuss a
term called the ratio of two elderly generations. This term refers to the
ratio of people 85 and older for every 100 persons 65-69 years of age.
They project that in
| 1950 this ratio was 12:100 |
| 1990 this ratio was 30:100 |
| 2050 this ratio will be 93:100 |
Over 100
At one time if you asked anyone if they would live to be 100, this question usually caused people to chuckle. It seemed that living to be 100 years of age was practically non-existent. In 1940, for instance, the number of people in the U.S. over 100 years of age was 3700. In 1990, that figure was now 61,000 people. By 2020, it is estimated that 214,000 people will be over 100 years of age. At this moment, females make up approximately 79% of people over 100 years old.
For more information about centenarians
go to the following link : http://www.nih.gov/nia/
(Click news and
events, then click press releases. In the browser page go to subjects:
aging,
general.Then
click on the article "New census report shows exponential growth in number
of
centenarians.")
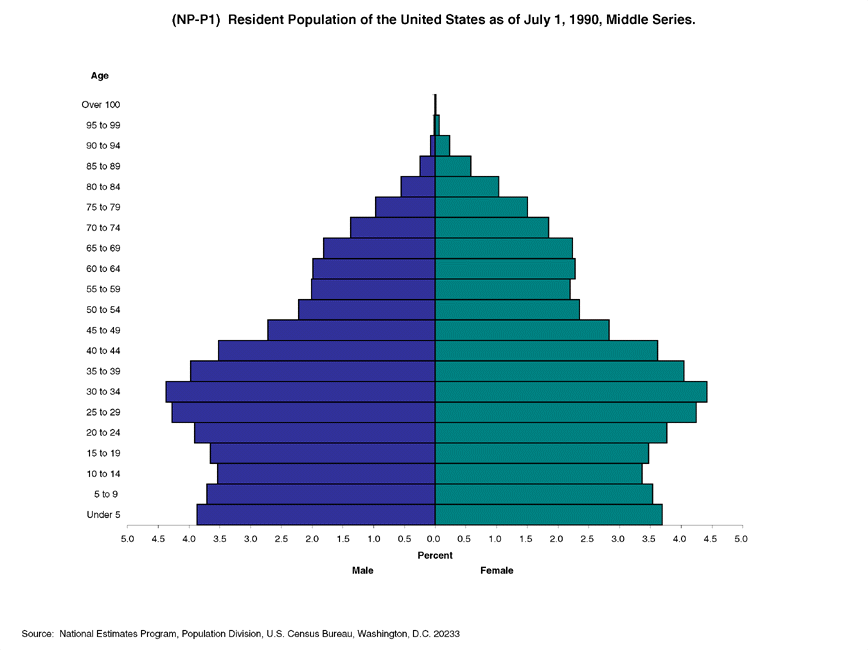
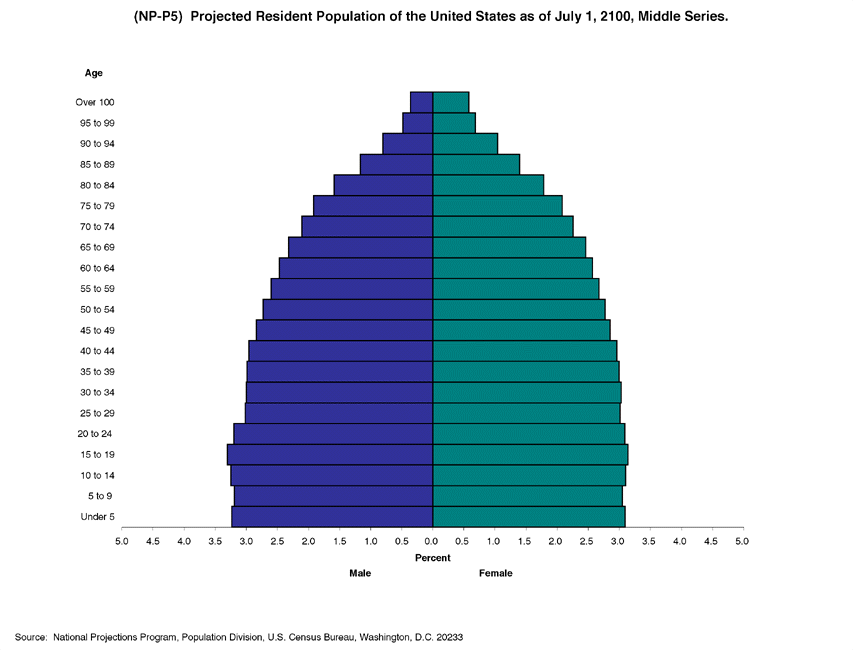
One way to illustrate the changes in the population by age is through the use of population pyramids. The tables below shows the population pyramid for 1990 and the projected population for 2100. Each horizontal bar represents a ten-year birth cohort (i.e., people born within the same 10-year period).


eQuestion#5:
Describe some things that strike you about the two population pyramids?
Include some
thoughts about the baby boomers.
Baby Boomers: Baby boomers were those
born between the years 1946 (right after WWII) and 1964. The number of
births in this period was 70% greater than the number of babies born in
the previous two decades (http://www.asaging.org/ASA_Home_New5.cfm).(For
this link: Go to publications, then to critical issues in aging).
Growth in Various Ethnic Groups
Minorities are the most rapidly growing sector of the older population.
African-Americans
The older African American population is projected to increase by 25.8% from 1990 to 2000 and 126% from 1990 to 2020. This increase is expected to more than twice that of older European Americans.
Latinos/Hispanics
This group is expected to increase
seven-fold by 2050. That is, an increase from 4% to 12% by 2050.
Percent of population 65 years and
over 1990 - 2050
|
|
|
|
| All Races |
|
|
| White |
|
|
| African American |
|
|
| Asian or Pacific Islander |
|
|
| Hispanic |
|
|
Projected Life Expectancy at Birth 1999-2050
Ethnicity 1999 2050
|
|
|
|
|
|
|
|
|
|
|
|
|
|
|
|
|
|
|
|
|
|
|
|
|
|
|
|
|
|
|
|
|
|
|
|
|
|
|
|
Atchley, R. C. (1996). Social forces and aging: An introduction to social gerontology. 8th edition. Wadsworth Publishing.
Crandall, R. C. (1991). Gerontology: A behavioral science approach. 2nd edition. McGraw Hill: New York.
Population Reference Bureau (1999) http://www.prb.org/
U.S. Bureau of the Census (2000) http://www.census.gov/
U.S. Department of Health and Human Services, Center for Disease Control, National Center for Health Statistics (2000). http://www.cdc.gov/nchs/datawh.htm
Below are the eQuestions for this chapter along with links that will help you answer the eQuestions as well as help you answer the writing assignments. Enjoy.
Chapter 1
eQuestion #1:
Taking a look at tables 1 and 2 and the link to the Population Reference
Bureau
(world population data sheet 1999) what strikes you about these data? Include
other
countries not in these tables in your answer.
eQuestion #2:
Before going on to the next section, what are some things that you think
have
contributed to the growing population of older adults in the United States?
Also,
looking at the table below, what are your thoughts about the distribution
of the
percentages of older adults across the United States?
eQuestion #3:
What are some factors that resulted in a decline in mortality rate?
eQuestion #4:
What are some things that you can think of that may explain why men and
women
differ in life expectancy?
eQuestion#5:
Describe some things that strike you about the two population pyramids?
Include some
thoughts about the baby boomers.
Links that will help you answer the questions and other writing assignments:
http://www.cdc.gov/nchs/datawh.htm
http://www.asaging.org/ASA_Home_New5.cfm