Section 5: Applications of DerivativesKCT logo

© 1999 by Karl Hahn

5.4 Drawing a Non-Blank (Graphing Problems)

If you have read The Little Prince by Antoine de Saint-Exupéry, then you remember when the Little Prince first appears, he asks the narrator to draw him a sheep. The first sheep the narrator draws is too sickly. The second is, in the Prince's estimation, a ram. The third is too old. Finally, not knowing exactly what the Little Prince wants, the narrator draws a box and tells him that the sheep is inside. And the sheep inside turns out to be just what the Little Prince had in mind.

In your past math classes you have been asked more often than you'd like to recall to draw a graph of this function or that function. And how often have the graphs you've drawn been too steep or too angular or the wrong shape or had some other fatal defect? And now in introductory calculus you are likely to be asked again to draw the graph of this or that function. If only you could just draw a box and assure your instructor that the graph he wants is inside.

But one thing has changed this time about your being asked to draw graphs, and that is the instructor's agenda. What you have learned about limits and derivatives will, if you apply it correctly, supply you with a box that only the graph you instructor asks for will fit into. And that's the point. By observing the calculus properties of functions, you will be able to determine a lot about a function's graph before you ever plot the first point -- things like where it has assymptotes, where it has maximums and minimums, where it has inflection points -- these form the box. And not many wrong answers will fit into that box.


Graph Problem 1

The best thing to do is to jump right in and try one. Let's do

               x2 + 1
   f(x)  =             
            x2 - 4x + 3
The graphing problems that appear on homeworks and exams usually give you hints by asking you to identify where the graph is increasing, where it is decreasing, where the critical points are, whether the critical points are maximums or minimums, and where the horizontal and vertical assymptotes are.

The function we have here falls into the category of being a rational function. That is, it's the ratio of two polynomials. When you get one of these, the first thing to do is to try to factor the polynomials -- especially the denominator. Here, the numerator is x2 + 1, which cannot be factored. But the denominator, x2 - 4x + 3, can be factored into (x - 1)(x - 3). That means that

                x2 + 1
   f(x)  =                
            (x - 1)(x - 3)
is entirely equivalent to the original function. This gives you your first clues about the behavior of this function. Observe that the denominator has zeros at x = 1 and at x = 3. Test the numerator at those same x's. If the numerator does not have zeros at exactly the same x's, then each unmatched zero in the denominator represents a vertical assymptote on the graph. So at this point you would draw two vertical lines, one at x = 1 and the other at x = 3. Because these vertical lines are assymptotic to the function, the graph of the function will, in the region of each assymptote, grow closer and closer to being parallel to the assymptote, but it will never cross the assymptote.

We can find out much more about the function by looking at its derivative. Since f(x) is a ratio, we have to use the quotient rule. The quotient rule instructs us to take the denominator times the derivative of the numerator minus the numerator times the derivative of the denominator all over the denominator squared in order to find f'(x).

             (x2 - 4x + 3)(2x) - (x2 + 1)(2x - 4)
   f'(x)  =                                      
                       (x2 - 4x + 3)2
When you multiply out the numerator and gather up like terms, you find that the x3 terms cancel and you are left with
              -4x2 + 4x + 4
   f'(x)  =                
             (x2 - 4x + 3)2
Observe that the denominator is squared and therefore it is never negative. So you can determine where the derivative is positive or negative soley by analysing the numerator of f'(x). And knowing where f'(x) is positive and negative will tell you where the function is increasing and decreasing respectively.

The best way to find out where f'(x) is positive and negative is to find where it is zero. Again, where it is zero is almost entirely dependent on the numerator. The denominator cannot cause the function to be zero. So we look for where the numerator is zero. To do this we use the quadratic formula. We find that the numerator has zeros at

                _
         1     Ö5
   x  =     ±    
         2      2
In decimals, that's approximately x = -0.61808339 and x = 1.61808339. There is only one more step to finding the zeros of f'(x). That is to plug the numerator's zeros (the x's we just found) into the denominator. Each of the numerator's zeros that is not also a denominator zero is a zero of f'(x). In this case neither of the numerator zeros we found cause the denominator to be zero as well. So at both of these x's we have f'(x) = 0. For this reason both of these x's are critical points.

Now we put the critical x's back into f(x) (you'll want a calculator to do this).

   f(-0.61808339)  =   0.2360679

   f(1.61808339)   =  -4.2360679
These two points ( (-0.61808339,0.2360679) and (1.61808339,-4.2360679)) will be points on the graph, so you might as well plot them. Label them as critical points. And that means that the trace of the graph will be horizontal as it passes through each them.

Two critical points divide the domain (that is the set of all possible x's) into three regions. The first is where x < -0.61808339. The second is -0.61808339 < x < 1.61808339. And the third is x > 1.61808339. We need to test just one x in each region to find out what the sign of f'(x) is in the entire region. So, x = -1 falls into the first region. x = 0 falls into the second region. x = 2 falls into the third region.

   f'(-1)  =  -1/16

   f'(0)   =   4/9

   f'(2)   =  -4/1
This means that in the first region, f(x) is decreasing because f'(x) is negative in that entire region. In the second region, f(x) is increasing because f'(x) is positive in that entire region. In the third region, f(x) is decreasing again because again f'(x) is negative for that entire region.

This also tells us which of the critical points is a minimum and which is a maximum. When x is less than the critical point, -0.61808339, f(x) is decreasing, and when x is just a bit greater than that critical point, f(x) is increasing. Think about it. On both sides of the critical point, f(x) must be more than what it is at the critical point. This clearly indicates that this critical point is a minimum. Likewise, when x is greater than the critical point, 1.61808339, f(x) decreasing. In the region where x is less than that critical point, f(x) is increasing. So on both sides of this second critical point, f(x) must be less than what it is at the critical point. This indicates that the second critical point is a maximum.

Finally look at the original f(x) one more time.

               x2 + 1
   f(x)  =             
            x2 - 4x + 3
If you take the limit as x goes to either infinity or to minus infinity, notice that the terms that become dominant are the x2 in the numerator and the x2 in the denominator. All other terms become insignificant compared to these two. So in the limit (in either direction) you end up with x2/x2 = 1. This clues you in that the horizontal assymptote is at y = 1, so draw a horizontal line there. As f(x) goes off to infinity you expect that it will grow closer and closer to being parallel to this line without crossing it. Likewise as x goes off to minus infinity.
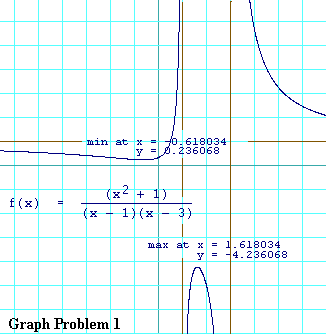
Graph for 1st example

Here, at last, is the graph itself. Look at what happens at each of the vertical assymptotes (which are shown in brown). In the region of the first one (where x = 1) we determined that f(x) is increasing. This means that as x approaches the assymptote from the left f(x) must head for positive infinity. On the other side of that assymptote f(x) is still increasing. So its trace must return from minus infinity just to the right of that assymptote. Likewise in the region of the second assymptote (where x = 3) we determined that f(x) was decreasing. That means that as x approaches that assymptote from the left, f(x) heads for minus infinity. And f(x) is still decreasing on the other side of the assymptote, so its trace must return from plus infinity just to the right of that assymptote.

If you make all of the observations we have made here and plotted just the two critical points, you can get the correct shape for the rest of the graph without using your calculuator at all beyond plotting those two points.

  1. On the extreme left the trace of f(x) must be near the horizontal assymptote, so f(x) must be near 1. In addition, since f(x) is decreasing in that region and must meet up with the point, (-0.61808339,0.2360679), without crossing the horizontal assymtote, we know that f(x) is less than 1 and greater than 0.2360679 until it gets to the first critical point.
  2. Going through the first critical point the trace of the graph must be horizontal. The graph reaches a local minimum here.
  3. Following the first critical point, f(x) is increasing, so the trace slopes up.
  4. As it approaches the first vertical assymptote, it heads for plus infinity without ever crossing that assymptote.
  5. To the right of the first vertical assymptote, the trace returns from minus infinity and is still increasing until it gets to the second critical point.
  6. Going through the second critical point the trace of the graph must once again be horizontal. The graph reaches a local maximum here.
  7. Following the second critical point, f(x) is decreasing.
  8. As it approaches the second vertical assymptote, the trace heads for minus infinity.
  9. Following the second vertical assymptote, f(x) is still decreasing. So it must be returning from plus infinity.
  10. As x goes to the extreme right, f(x) continues to decrease, but the trace must approach the horizontal assymptote at y = 1 without crossing it.
If you followed all those instructions, you would not have to know any of the points other than the two we've discussed to get the general picture just about right.

Important Pitfall in the Above Method

To decide where f(x) was increasing and decreasing, we divided its domain according to the zeros of f'(x). In this example we ended up with three such regions. Then we analysed just one point in each region to determine the sign of f'(x) in that region. This will work most of the time but not all the time. It works here because the denominator has only simple zeros. That is, the denominator contained a (x - 1) factor and a (x - 3) factor. So it is said to have simple zeros at x = 1 and at x = 3. But if it had contained, for example, a (x - 1)2, then we would say that it has a double zero at x = 1, and a double zero is not a simple zero.

The important thing to remember here is that the sign of f'(x) will not change as a result of x passing through a simple zero of the denominator of f(x) (provided the numerator does not also have a zero at the same x). That is why the method we used worked. The same cannot be said about x passing through a double zero of the denominator.

If you did not know this rule, then the safest thing for you to do would be to divide the domain of f(x) into more regions. Again use each zero of f'(x) as a dividing point between regions. But also use each vertical assymptote as a dividing point as well. In this problem that would give you five regions:

  1. x < -0.61808339
  2. -0.61808339 < x < 1
  3. 1 < x < 1.61808339
  4. 1.61808339 < x < 3
  5. x > 3
Now you would choose a sample point from each of these regions and determine the sign of f'(x) at each of the sample points. You can be absolutely sure, regardless of double or multiple zeros in the denominator, that the sign of f'(x) will persist throughout each region (this is because f'(x) is continuous within each region, so the intermediate value theorem applies. If f'(x) does not cross zero, it cannot change sign). If you chose x = -1, x = 0, x = 3/2, x = 2, and x = 4, you would have the following table:
   f'(-1)   =  -1/16

   f'(0)    =   4/9

   f'(3/2)  =   16/9

   f'(2)    =  -4/1

   f'(4)    =  -44/9
From this table you can see that f'(x) changes sign only at x = -0.61808339 and at x = 1.61808339. In any problem where the denominator's zeros are not simple, you must use the vertical assymptotes to divide the domain into more regions. In the case where the denominator does have only simple zeros (like this problem), you can still divide up the domain into more regions using the vertical assymptotes if you want to. And you will still get the right answer. It's just a small amount of extra work.


Graph Problem 2

Here's another example:

             _____
   f(x)  =  Ö1 + x (x2 - x - 4)
The typical problem might read:
Graph f(x) finding all zero crossings, regions where f(x) is increasing and decreasing, all critical points, and whether they are maximums, minimums, or neither. In addition, describe what f'(x) does as x approaches -1 from above.

Step 1: Determine the domain of f(x). The sqrt function does not admit negative arguments. So what restrictions does that place on x? When you decide what the domain is, click here.


That was pretty easy, eh? You should have gotten that the domain is everywhere where x ³ -1. That way, x + 1 ³ 0, and sqrt(x + 1) will remain defined. That means that the trace of the graph will not exist at all anywhere to the left of -1 on the x axis.

Step 2: Find where f(x) is zero. This will determine the crossing points. Remember that for a product to be zero, one or both of its factors must be zero. Work out where the zero crossings are, then click here.


You were looking for every place every place that either sqrt(x + 1) = 0 or x2 - x - 4 = 0. Clearly sqrt(x + 1) is zero when x + 1 is zero, and that happens only when x = -1. To find where x2 - x - 4 is zero, you have to use the quadratic formula. And the solutions it gives you are

              __
         1   Ö17
   x  =    ±    
         2    2
In decimals that's approximately x = -1.561552813 and x = 2.56155813. Notice that the first of these solutions is less than -1, meaning that it is outside of the domain of f(x). That means we can discard that solution, and we are left with the following two zero-crossing points:
   x  =  -1

   x  =  2.56155813
Mark them on your graph along the x axis. This is all well and good, but so far all we have done on this function is algebra. Now it's time to do some calculus.

Step 3: Find the derivative of f(x). Since f(x) is a product of sqrt(x + 1) and x2 - x - 4, you will need to use the product rule. And since sqrt(x + 1) is a composite of x + 1 with taking the square root, you will have to use the chain rule as well. Work out this derivative, the click here to check your answer.


The derivative of x + 1 is simply 1. So the derivative of sqrt(x + 1) is

      1
          
   2Öx + 1
And the derivative of x2 - x - 4 is easy. That's 2x - 1. Putting it all together using the product rule, you should have gotten:
              _____                 1
   f'(x)  =  Öx + 1 (2x - 1)  +          (x2 - x - 4)
                                 2Öx + 1

Step 4: Find where f'(x) is zero. That's where the critical points will be. So you will rewrite the above equation, but replace the symbol, "f'(x)", with zero. Then you are going to solve the equation that results for x. Hint: Multiply through by 2 sqrt(x + 1). When you are done, click here to check your work.


If you followed the hint, you would have been solving the equation

   0  =  2(x + 1)(2x - 1)  +  (x2 - x - 4)
When you multiply out the left-hand summand you get
   0  =  4x2 + 2x - 2  +  x2 - x - 4
and on gathering like term you get
   0  =  5x2 + x - 6
Again the
quadratic formula comes to your aid. You find that
               ___
          1   Ö121
   x  =     ±     
         10    10
So x is either -12/10 or 10/10. Since -12/10 is less than -1, it is outside the domain of f(x), so we discard that solution. That leaves the only critical point at x = 1. So we go ahead and plot the critical point. I get
               _
   f(1)  =  -4Ö2  =  -5.656854249...

Step 6: Using what you know about f'(x), divide up the domain of f(x). This function has no zeros in its denominator because it has no denominator. So the only thing there is to divide it up is the one critical point. This should be easy. Click here when you're ready.


One division point can only mean that you divide the domain of f(x) into two regions, one less than the division point, the other greater than the division point. The division point, in this case, is x = 1, which you already determined is the sole critical point of this function.

The domain of f(x) you already determined was restricted to x ³ -1. So the two regions are

  1. -1 £ x < 1
  2. x > 1

Step 7: Pick a sample point in each region and evaluatef'(x) at each sample point. This should be easy. The only hint I'll give you is to observe that the region, -1 £ x < 1, has an endpoint included. Don't choose the endpoint as a sample. When you are done picking and evaluating, click here.


I picked x = 0 as my sample point from the region, -1 £ x < 1, and x = 2 as my sample point from the region, x > 1. There are, of course, an infinitude of other choices for each sample, just as long as they are each chosen from the correct region of the domain. Here is my table of f'(x) at each of the samples:

   f'(0)  =  -3
                      _
               _     Ö3
   f'(2)  =  3Ö3  +     
                      3
This indicates that in the region, -1 £ x < 1, f(x) is decreasing. In the region, x > 1, f(x) is increasing. Why? Because in the first region, f'(x) has the same sign as the sample point throughout, and f'(0) is negative. Likewise in the second region, f'(x) has the same sign as the sample point throughout, and f'(2) is positive.

Step 8: Plot the graph. You now know where the graph is increasing, decreasing, where its zeros are, and where its minimum is. You should be able to make a rough plot incorporating all these features. Remember that on the left side of the graph, x = -1 must be the end of the trace, because you run out of domain there. When you are done plotting, click here to see the graph.
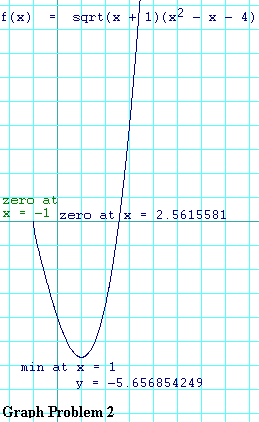


graph for 2nd example

There you have it. Give yourself full credit if you got the general shape right as well as where the minimum is and where the zero crossings are.

Finally the question asked what happens to f'(x) as x approaches -1 from above. Look again at the expression for f'(x) (click here to see that equation again). Observe that it has a denominator term of sqrt(x + 1), which goes to zero as x goes to -1. We also know that the sign of f'(x) throughout the region, -1 £ x < 1, is negative. So we would have to expect that f'(x) goes to minus infinity as x goes to zero. Or in other words, right at x = -1, the trace of the graph is vertical. Even at points very close to x = -1 the trace still has a defined slope, but at that one point the tangent line would have to be vertical.


Graph Problem 3

Graph the function

               x
   f(x)  =        
            1 - x2
identifying all horizontal and vertical assymptotes, all zero crossings, all critical points (and whether they are maximums or minimums), and all inflection points.

Step 1: Factor the denominator. This will tell what the domain of this function is and where the vertical assymptotes are. Click here when you are done.


The denominator factors according to the difference of squares, giving you

               x             x
   f(x)  =          =                
            1 - x2     (1 + x)(1 - x)
This shows that the denominator has zeros at x = ±1. So those two x's are excluded from the domain of f(x). They are also where the vertical assymptotes lie. So draw a vertical line at x = 1 and another at x = -1.

Step 2: Identify the zero crossings. Remember that only the numerator being zero can make a quotient be zero. When you find an x where the numerator is zero, remember to test the denominator at that x as well. That's because you can't have a zero crossing at an x where f(x) is undefined. When you are done, click here to continue.


The numerator of f(x) is simply x, and that has a zero only at x = 0. When you put zero for x into the denominator, you get 1, so the function is defined at that x. Hence f(x) has a zero crossing at x = 0. You have your first point to plot at (0,0).

Step 3: Find the derivative of f(x). You will need that to determine where the critical points are. Here is f(x) again so that you can view it while you're working on the first derivative.

               x
   f(x)  =        
            1 - x2
Click here when you are done.


You should have used the quotient rule to take this derivative. The numerator expression is x. The denominator expression is 1 - x2. Here is quotient rule done out for you.

             (1 - x2) - x(-2x)     1 - x2 + 2x2       1 + x2
   f'(x)  =                     =                =           
                 (1 - x2)2           (1 - x2)2      (1 - x2)2

Step 4: Find the critical points. Remember that they occur only where f'(x) is zero. Remember also that f'(x) can only be zero at x's where its numerator is zero. When you have figured this part out, click here.


The numerator expression for f'(x) is 1 + x2. There is no real value of x that makes this expression equal to zero. Therefore you must conclude that f(x) has no critical points.

You can very easily, though, determine that f'(0) = 1. Make sure you can see why. You already determined that f(0) = 0 and you plotted a point at (0,0) to show that. Since the slope of the curve at that point is clearly 1, draw a very short diagonal line that slopes up at 45 degrees through the point at (0,0). Note that this occurs between the two vertical assymptotes you determined earlier. Since there are no critical points, it must be true that the slope is positive (that is the curve ramps up) throughout the entire region between the vertical assymptotes. Indeed, since both numerator and denominator of the quotient for f'(x) are guaranteed never to be negative, you are assured that f(x) slopes up everywhere it is defined.

Step 5: Find the second derivative of f(x). You will need this in order to identify inflection points. Here is the first derivative again so that you can view it while you're working on the second derivative:

               1 + x2
   f'(x)  =           
             (1 - x2)2
When you are done calculating and simplifying,
click here to continue.


Again you had to apply the quotient rule. The algebra was a little hairier this time. Here it is done out for you.

             (1 - x2)2(2x) - (1 + x2)2(1 - x2)(-2x)
   f"(x)  =                                        
                          (1 - x2)4


             2x - 4x3 + 2x5 + (4x)(1 + x2)(1 - x2)
          =                                       
                         (1 - x2)4
Observe that the right-hand term in the numerator multiplies out to a difference of squares.
             2x - 4x3 + 2x5 + (4x)(1 - x4)
   f"(x)  =                               
                      (1 - x2)4


             2x - 4x3 + 2x5 + 4x - 4x5
          =                           
                    (1 - x2)4


             -2x5 - 4x3 + 6x     -2x(x4 + 2x2 - 3)
          =                   =                   
                (1 - x2)4            (1 - x2)4

Step 6: Determine the inflection points. Remember that they are where f"(x) = 0. Remember also that for f"(x) to be zero, its numerator must be zero (and its denominator must not be zero at that same x). And don't be intimidated by that 4th degree polynomial in the numerator. You can factor it. To do so, think of it as a quadratic in x2. When you are done, click here.


To find the inflection point(s), you had to determine where the numerator of f"(x) was zero. The numerator was

   -(2x)(x4 + 2x2 - 3)
Clealy this expression is zero when x = 0. It is also zero when (x4 + 2x2 - 3) = 0 as well. Even though this is a fourth degree polynomial, it is not hard to factor. If you substitute u = x2, you have
   u2 + 2u - 3
which you can factor either in your head or by using the
quadratic formula, and you find that it is the same as
   (u + 3)(u - 1)
Substituting back the x2 for u, you get
   (x2 + 3)(x2 - 1)
So what values of x lead to this expression being zero? Well either x2 + 3 = 0 or x2 - 1 = 0. The first possibility is no possibility at all. There is no real value of x that you can square and add to 3 to get zero. The second possibility leads to numerator zeros at x = ±1. But those values of x are precisely where f(x) is undefined. So you must discount them as possible inflection points. That leaves you with only x = 0 as an inflection point. So you know that the one point you have plotted so far, (0,0), is an inflection point. Label it as such.

Step 7: Find the limits of f(x) as x goes to infinity and minus infinity. You will need this information for finding the horizontal assymptotes. Also pay attention to whether f(x) is positive or negative as x gets big in the positive direction or in the negative direction. When you have pondered this and come to a conclusion, click here -- you're almost done. Here is the original f(x) again so you can look at it while you ponder.

               x
   f(x)  =        
            1 - x2


Observe that the highest order term in the numerator is x and the highest order term in the denominator is x2. So as the magnitude of x gets big in either direction, the denominator's magnitude will get big faster than the numerator's. The limit in either direction can only be zero. So to the left, the trace of f(x) will have to approach y = 0 but never cross it. Likewise to the right. And the line, y = 0 is your horizontal assymptote.

But which side of y = 0 will the trace approach it from? When the magnitude of x is greater than 1, the denominator is guaranteed to be negative. Indeed the denominator remains negative everywhere outside of the two vertical assymptotes. But the numerator, x, is negative on the left and positive on the right. So you must conclude that to the left of the left-hand vertical assymptote, f(x) must be positive, and to the right of the right-hand assymptote, f(x) must be negative.

Step 8: Plot the graph using all the facts you have discerned so far. Go ahead and do so, then click here to see my graph and my explanation of it.


graph for 3rd example

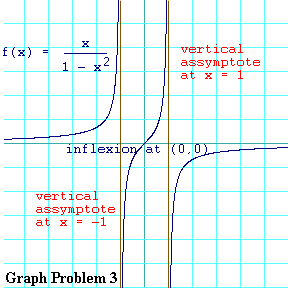
Well here it is. From left to right, the explanation: When x is very negative, we know that f(x) is near zero but positive. We also know that it does not cross the y axis anywhere left of the vertical assymptote at x = -1. We also know that its slope is always up. From that we must conclude that as it gets near to the vertical assymptote at x = -1, the trace must take off for plus infinity.

In the region between the two assymptotes we know that f(x) continues to slope up. So just to the right of the vertical assymptote at x = -1, the trace must be returning from minus infinity. We know that in this region it must pass through the point, (0,0), and because there is an inflection point there, it must take a jog from decreasing its slope as you go rightward to increasing its slope in that direction. You also know it must pass through the point, (0,0), ramping up at a 45 degree angle. Its slope must get steeper and steeper after that. Since it continues to slope up the entire way as it approaches the other vertical assymptote at x = 1, we know that the trace must take off for plus infinity as x gets near the vertical assymptote.

Finally in the region to the right of the vertical assymptote assymptote at x = 1 you have that f(x) still slopes up. So it must return from minus infinity. And we know that as x heads toward the rightward extreme, the trace of f(x) must stay negative and approach the horizontal assymptote at y = 0.

Some final notes: If you study the expression for f(x) you will see that it is an odd function -- that is f(-x) = -f(x) for all x where f(x) is defined. Make sure you can see why this is. This gives you a symmetry with which to plot the graph. The left half of the graph must be an inverted copy of the right half, with the axis of symmetry being at x = 0.

If you were ambitious about getting the shape of the graph more accurately, you could, for example, have determined what values of x the slope of the trace is equal to 1. You already know one point where this happens, and that is at x = 0. Are there others? The equation you would have to solve to find out is f'(x) = 1. Or, subtracting 1 from both sides and putting it over a common denominator:

           1 + x2    (1 - x2)2     1 + x2 - 1 + 2x2 - x4     -x4 + 3x3
   0  =            -            =                         =           
         (1 - x2)2   (1 - x2)2            (1 - x2)2          (1 - x2)2
Again, you only have to worry about when the numerator of this is zero. So all you have to do is solve
   -x4 + 3x2  =  -x2(x2 - 3)  =  0
So to make the numerator zero, either x2 = 0 or x2 = 3. The first possibility we've already accounted for. We know that the slope is 1 at x = 0. The other places where the slope will be 1 are
           _
   x  =  ±Ö3  =  ±1.732050808...
If you eyeball the graph, you will be able to see this. If you knew this when you plotted the graph, it would give you more information about the shape of the graph, as you would have had to plot a 45 degree up-slope at both of these x's. But know points off if you didn't do this as the original problem didn't ask you to.


Graphing Problem 4

Graph the following function, identifying all zero crossings, critical points, inflection points, and horizontal and vertical assymptotes.

                x
   f(x)  =          
            (1 - x)2

Step 1: Factor the denominator. This is hardly a step since it already is factored. So just identify where the denominator is zero, which you need to know in order to put in your vertical assymptotes. Then click here.


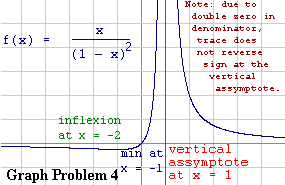
Clearly the only place where the denominator is zero is at x = 1. So that is where you only vertical assymptote is. Draw it in.

Step 2: Identify the zero crossings. This should be a piece of cake after the last problem. Click here when you've got it.


The only place where the numerator can be zero is at x = 0. And the denominator is not also zero at that x. Hence x = 0 is a zero crossing. Plot a point at (0,0).

Step 3: Find the derivative of f(x). This will enable you to find the critical points. Here is the function again so you can see it as you work this step:

                x
   f(x)  =          
            (1 - x)2
When you are done calculating,
click here to continue.


You needed to use the quotient rule to take this derivative. Here it is done out for you:

             (1 - x)2 - x(2)(1 - x)(-1)     (1 - x)( (1 - x) + 2x)
   f'(x)  =                              =                          =
                     (1 - x)4                      (1 - x)4


               x + 1
          =          
             (1 - x)3
To get the middle expression from the left-hand expression, you factor a (1 - x) from the numerator summands. To get the right-hand expression from the middle expression, you cancel the common factor of (1 - x) from numerator and denominator and you gather like terms in numerator.

Observe that f'(0) = 1. This means that through the one point you have plotted so far, the one at (0,0), you can draw very short 45 degree line sloping up.

Step 4: Identify the critical points. You need to find where f'(x) is zero. This one is pretty easy. When you have it, click here.


Remember that you the only candidates for critical points are where the numerator of f'(x) is zero. That only happens at x = -1. You then should check the denominator to see if it also has a zero at that x. It doesn't, so x = -1 is your only critical point. To find the y value of the critical point, put this x value back into the original function. What do you get. I get f(-1) = -1/4. So your critical point is at (-1,-1/4). Plot that point, draw very short horizontal line through it, and label it a critical point.

Step 5: Find the second derivative of f(x). This will enable you to identify any inflection points. If you make no mistakes doing this calculation, you should get a simplifying cancellation. Since you are taking the derivative of f'(x) to find the second derivative of f(x) here again is f'(x):

              1 + x
   f'(x)  =          
             (1 - x)3
When you have it,
click here.


Here is the second derivative done out for you:

             (1 - x)3 - (1 + x)(3)(1 - x)2(-1)
   f"(x)  =                                   
                        (1 - x)6
You should see that there is a common factor of (1 - x)2 in the numerator and denominator. You need to cancel it.
             (1 - x) + 3x + 3      4 + 2x
   f"(x)  =                    =          
                 (1 - x)4         (1 - x)4

Step 6: Identify any inflection points. You do this by solving f"(x) = 0. You've already done the hard part of this step, which was to take the second derivative. Finding where f"(x) is zero on this function should be easy. Click here when you have it.


The only candidates for inflection points are where the numerator of f"(x) is zero. The numerator is 4x + 2. The only x that makes that zero is x = -2. At the inflection point you have f(-2) = -2/9. Plot the point, (0,-2/9), and label it an inflection point.

Step 7: Find the limits of f(x) as x goes to infinity and minus infinity. This will tell you where any horizontal assymptotes are. Again pay attention to whether f(x) is positive or negative as it goes to infinity and as it goes to minus infinity. With regard to these limits, this problem is very similar to the Graphing Problem 3. Click here when you finish this step.


Once again you have a denominator that grows with the square of x and a numerator that grows only linearly with x. So as the magnitude of x gets big, you expect that f(x) will get close to zero. And that's where the horizontal assymptote of this one is.

Observe also that the denominator of f(x) is always positive. This means that the sign of f(x) is entirely dependent on the numerator, which is equal to x. Hence whenever x is positive, f(x) is also positive. And likewise, whenever x is negative, f(x) is negative.

From all you have done so far you can reach certain conclusions about the trace of this f(x). You know that f(0) = 0 and that f(-1) = -1/4. The latter point you also know to be a critical point. In addition, you know that as x gets very negative, f(x) goes to zero. So you have f(x) = 0 at a point to the right of the critical point and f(x) heading back toward zero to the left of the critical point. At the critical point, f(x) is negative. You can conclude from all this that the critical point must be a minimum.

Since the critical point is a minimum, the function, f(x), must be concave up at the critical point. To the left of the inflection point the concavity must turn around, so expect the function to be concave down in that region. You can test this hypothesis by putting a value to the left of the inflection (say x = -3) into f"(x). If the result is negative, then the function is concave down at that x.

To the right of the critical point you have f'(x) positive until it gets to the vertical assymptote. So expect the trace to head for plus infinity as it approaches that assymptote from the left. But when x > 1 you find that f'(x) is consistently negative. That means f(x) must slope down as it returns from the assymptote. So it must return from plus infinity. Finally, you know that as x gets big in the positive direction, f(x) must head for zero without crossing the x axis.

Step 8: Plot the graph. Then click here to see how you did.


Graphing problem 4

Here it is. Try doing the same thing I did last time in my final notes to demonstrate that the only place where the trace slopes up at exactly a 45 degree angle is at x = 0.

Also recollect the cautionary note I gave you in Graphing Problem 1. That is that the first derivative retaining its sign when x passes through zero in the denominator is guaranteed only if it is a single zero. Here we have a double zero in the denominator at x = 1. And for that reason the first derivative does change sign at the denominator's double zero. Indeed if you have a multiple zero in the denominator, the first derivative will change sign if and only if the multiplicity of that zero is even. It will retain its sign whenever the multiplicity of that zero is odd.


Return to Table of Contents

Move on to 6.1 Be Fruitful and Multiply (exponentials and logs)

email me at hahn@netsrq.com