Using the Spreadsheet

In this tutorial we see some basic use of the spreadsheet.

From the View menu, hide the Algebra View and show the Spreadsheet View.  After showing the Spreadsheet View, you may have to click and drag the right edge of your screen to make the spreadsheet appear.

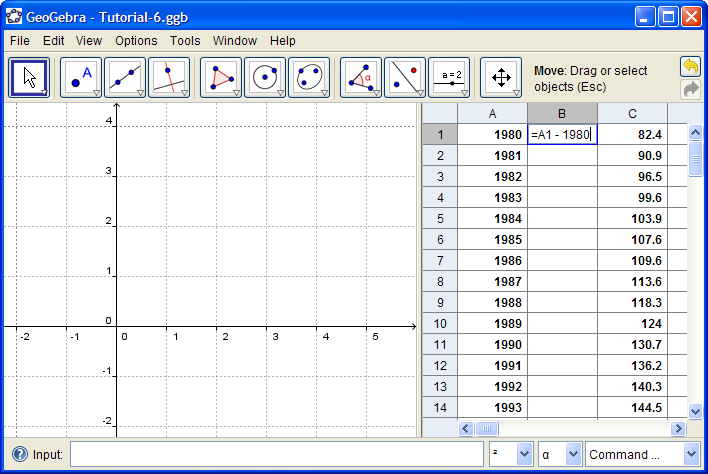
Copy the data at the bottom of this tutorial and paste them into columns A and B.  (Select cell A1 then Ctrl-V)


Right-click the heading of column B and select "Insert Left".  In cell B1 type    =A1 - 1980     then hit enter.

Select cell B1, grab the "fill corner" on the bottom right of the cell, then drag it down to row 29, completing the table.


Select columns B and C, right-click, and choose "Create List of Points"

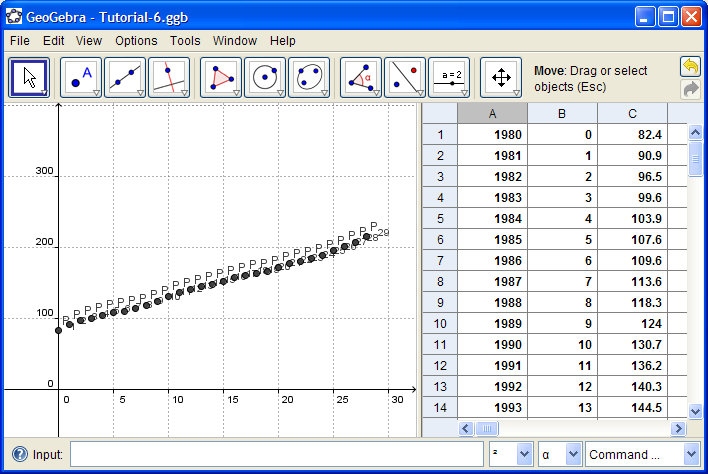
Holding the shift key, drag the axes to change their scale and get the points into view.


Enter the Object Properties dialogue box (Ctrl-E) select the points, and turn off their labels.

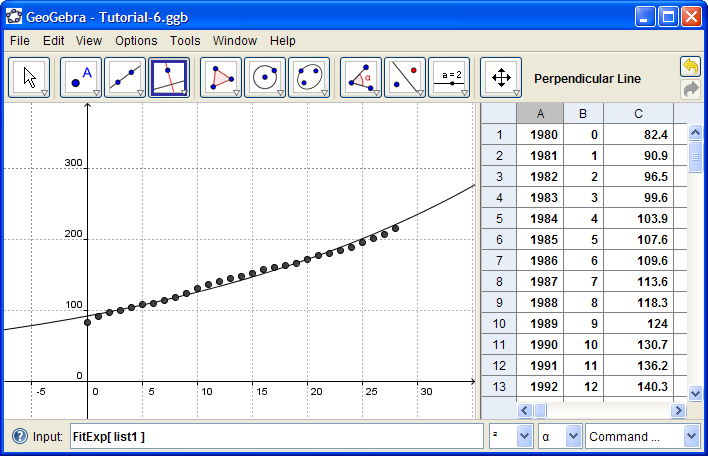
If you look in the Algebra View, you'll see that the points are all gathered in a list, called  list1 .  Type the command   FitExp[ list1 ]  into the Input Bar.

In the Algebra View you can get the equation of this graph.


Browse through the command list; there are many statistics commands available that you can use with data in the spreadsheet.


Back to Home Tutorial Page

Data:
The consumer price index for all urban consumers, U.S.A.  Obtained from the Bureau of Labor Statistics, http://www.bls.gov/data/ .
1980 82.4
1981 90.9
1982 96.5
1983 99.6
1984 103.9
1985 107.6
1986 109.6
1987 113.6
1988 118.3
1989 124
1990 130.7
1991 136.2
1992 140.3
1993 144.5
1994 148.2
1995 152.4
1996 156.9
1997 160.5
1998 163
1999 166.6
2000 172.2
2001 177.1
2002 179.9
2003 184
2004 188.9
2005 195.3
2006 201.6
2007 207.34
2008 215.3